The Mystery of Cost of Equity (Ke)
Hello readers,
in this article we will understand the what is cost of equity and how much return can expect from any investments. Imagine you want to buy shares in a company because you think it will grow and make you money.
But before you decide, you need to know something important: how much return do you expect for taking this risk?
That's where the Cost of Equity comes in—it's like a magic number that helps you figure out if investing in a company is a good idea.
first of what is it actually?
Let's start with a simple analogy.
The Cost of Equity (Ke) represent the return that shareholder expect from their investment in a company. It is essentially the compensation shareholders demand for taking the risk of owning stock instead of safer investment bonds.
Why is it Important?
For the Businesses, Knowing the Cost of Equity is because it influence decision on how to finance project and operations. It helps in setting the financials goal and evaluating the investments opportunities.
so that lets understand that how to asses the Cost of Equity:
There are a few methods to calculate the cost of equity, but a commonly used approach is the Capital Asset Pricing Model (CAPM).
Now, What is Capital Asset Pricing Model (CAPM)?
here is the explanations about the Capital Asset Pricing Model (CAPM):
The Capital Asset Pricing Model (CAPM) is a tool used to figure out how much return you should expect from an investment.
It works by looking at two things: how much you could earn from a safe investment (like a government bond) and how much the entire market is expected to return.
If your investment is riskier than the safe one, CAPM says you should expect to earn more to make up for that extra risk. It's like a balancing scale: the riskier the investment, the higher the potential reward.
Here’s a simplified version of how it works:
Risk-Free Rate: Start with the risk-free rate, which is the return on a secure investment like government bonds. This represents the minimum return investors would accept without taking on any risk where is no reinvestment risk and no default risk.
Reinvestment Risk:
Just assume that,
You're putting money aside each month in a piggy bank (like a fixed-income investment).
You're happy because it earns a steady amount of interest (like coupon payments on a bond).
But there are reinvestment risk involve.
Imagine interest rates go down overall. Now, when you take out your saved money to reinvest it elsewhere, you might only find things that earn less interest.
So, even though you get your original money back, you miss out on the higher earnings you were used to. It's like the gadget you saved for keeps getting more expensive!
Default Risk:
Just assume that,
Let's say you loaned some money to your friend for a new game (like buying a bond from a company).
They promised to pay you back with interest (like the company promising to return your money with interest payments).
Default risk is like your friend forgetting about the loan and moving away (the company failing to repay).
You might never see your money again! This could seriously mess up your plans for that new gadget.
Key Differences:
Reinvestment risk affects your future earnings, not your original investment.
Default risk means you might lose some or all of your initial investment.
Note: The Risk free return can be equal to real time GDP growth rate + inflation rate
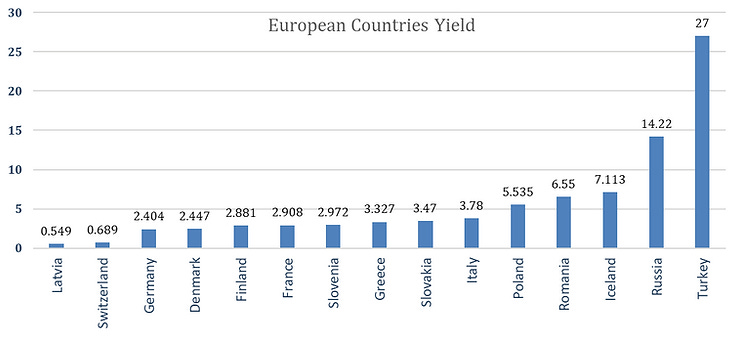
What are we implicitly assuming about the US treasury when we use any of the treasury numbers?
In this case I will always take lower of these chart as Latvia bond rate is 0.549%.
Can 10 year bond Yield in negative if yes, Why, what is the reason behind of that?
Because of Sometimes, central banks set interest rates very low or even negative. This can make bonds seem more attractive compared to other investments, even with a negative yield. Investors might be willing to accept a small loss on the bond to park their money safely.
What if, there is no any risk free rate for any country then we convert their currency to USD or any other and take the Risk free rate of that converted currency specific country.
For example: Let’s assume that I am valuing the Afghanistan’s Company but the problem is the there is no Afghanistan risk free rate. Then I will convert their statement currency whatever receive from the company to another currency and take that converted currency specific country risk free rate.
So, if the all countries in the world except USA are not the mature market than USA. So what will do?
We check that company default spread.
Default Spread? Now what is this?
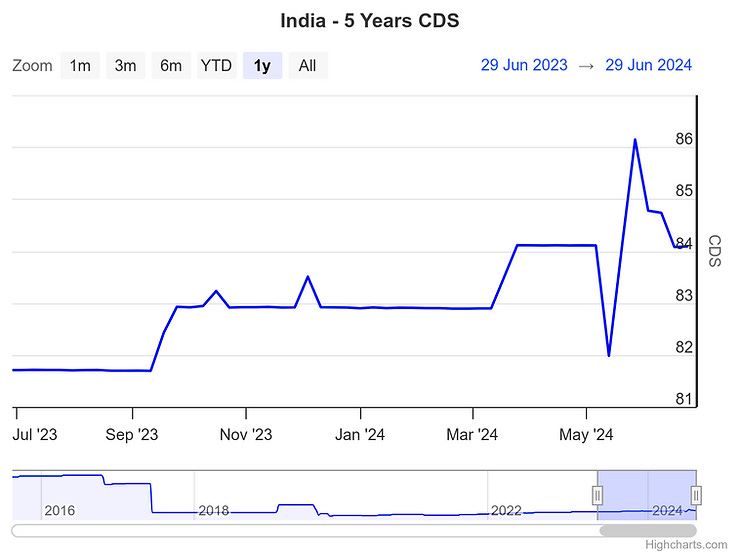
The default spread will be taken from CDS point of the country
A credit default swap (CDS) is a financial agreement that functions like an insurance contract for debt.
Imagine a credit default swap (CDS) as a kind of insurance for a loan. Here's the breakdown:
o Someone owes you money (borrower). Maybe it's a company bond you bought.
o You're worried they might not pay you back (default).
o You make a deal with another person (seller). You pay them a regular fee (like an insurance premium).
o If the borrower defaults (doesn't pay), the seller pays you back. Essentially, they take on the risk in exchange for your fee.
So, a CDS helps you protect yourself from losing money if someone defaults on a debt. It's like a safety net for your investment.
This is readily available for each country in the world.
The Current CDS Point is 84.09 points.
Change into Percantage like 100 points is equal too 1%
So that 84.09 points = 84.09 / 100 = 0.8409% (The Current CDS Rate in India)
Calculating a CDS involves estimating the value of two things: the ongoing payments made by the buyer (protection buyer) and the potential payout by the seller (protection seller) if a default occurs. Here's a simplified breakdown:
Components of a CDS Calculation:
Notional Amount: This is the total debt value insured by the CDS contract. Imagine it as the maximum payout if a default happens. It's typically based on the principal amount of the underlying debt (like a bond).
Premium Rate: This is the percentage of the notional amount that the buyer pays the seller regularly (e.g., annually or semi-annually). It reflects the perceived risk of default by the borrower. Higher risk means a higher premium rate.
Here's a simplified formula (not used in real markets):
Premium = Notional Amount Premium Rate Frequency (of payments)
Example (assuming hypothetical values):
Notional amount = $100,000
Premium rate = 1% (representing low risk)
Frequency = 2 (payments per year)
Premium per payment = ($100,000 * 1%) / 2 = $500
In reality, CDS calculations are more complex and involve:
Market factors: Supply and demand for CDS contracts can influence the premium rate.
Recovery rates: If a default occurs, there might be some recovery of the debt, reducing the seller's payout.
Upfront payments: Sometimes, a one-time upfront fee is paid by the buyer.
Complex financial models: These models assess the probability of default and other factors to determine a fair price for the CDS contract.
The Workings of a CDS:
The CDS contract is signed: Buyer agrees to pay premiums, seller agrees to pay upon a credit event.
The buyer pays premiums regularly. These payments flow to the seller throughout the CDS contract term.
Two scenarios can unfold:
No default: If the borrower fulfills their debt obligations, the CDS contract expires, and no payout happens. The buyer keeps paying premiums but receives no return.
Default occurs: If the borrower defaults (or a trigger event happens), the buyer makes a claim, and the seller pays the notional amount (or a portion of it based on recovery rates) to the buyer. The CDS contract terminates.
The latest news on CDS for mutual fund trade from Mint. Source
SEBI, the Securities and Exchange Board of India, has proposed increased flexibility for mutual funds (MFs) in buying and selling Credit Default Swaps (CDS). This move aims to develop the debt market in India.
Current Regulations:
Mutual funds are currently allowed to buy CDS only for hedging purposes (to protect against existing bond holdings).
This is limited to Fixed Maturity Plans (FMP) with a tenor of over one year.
SEBI's Proposal:
Allow mutual funds to buy CDS for all types of schemes, not just FMPs.
Permit mutual funds to sell CDS as well, except for overnight and liquid schemes.
Why the Change?
This proposal follows the Reserve Bank of India's (RBI) 2022 revised framework for CDS, aimed at developing the debt market.
Allowing MFs to buy and sell CDS is expected to:
Increase liquidity in the CDS market
Encourage more participation
Improve price discovery
Enhance risk management for investors
Additional Measures:
Mutual funds should only buy CDS from rated programs.
CDS positions should be closed within seven days of selling the protected debt security.
Mutual funds should use Two-way Credit Support Annex (CSA) to reduce counterparty risk.
Next Steps:
SEBI is seeking public comments on this proposal until July 2024. After considering feedback, the regulator will decide on the final implementation of these changes.
This move by SEBI is seen as a positive step towards developing India's debt market and providing investors with more tools for managing risk. However, some concerns remain about the potential for increased speculation and complexity in the market.
In practically how we can calculate the Risk free rate;
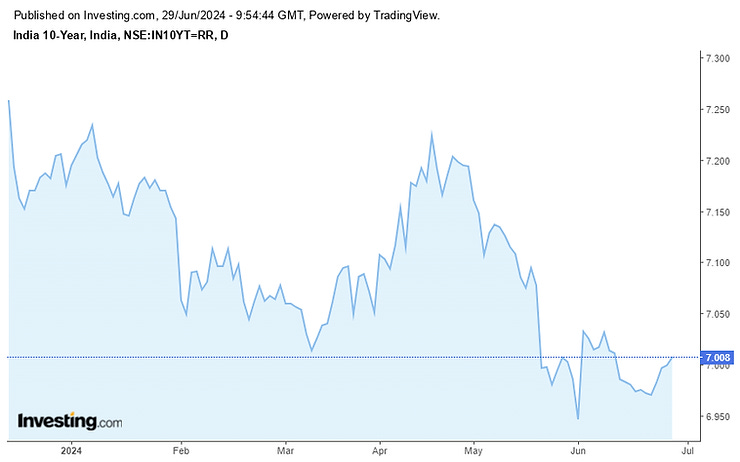
1st We will take 10 years Govt. Bind Yield of India as a proxy of Risk Free Rate.
10-Years Indian Government Bond Yield Chart:
Source: Investing.com
So the Calculating the Pure Risk free rate is like;
Risk Free Rate = 10 years govt bond (Indian) - CDS of India
Risk Free Rate = 7.008% - 0.8409% = 6.167%
Market Risk Premium: Next, determine the market risk premium. This is the additional return investors expect for investing in the stock market rather than risk-free investments. It reflects the overall riskiness of the market.
Here's how you can calculate it:
Identify the expected return of the market (Rm): This is the average return you expect from the stock market. You can use historical data for this, like the average annual return of a stock market index. in my calculation, I have taken NIFTY50.
Identify the risk-free rate (Rf): This is the return on a safe investment, typically government bonds. For example, you might use the yield on 10-year Indian Treasury bonds - CDS like earlier as explained about the Risk Free Rate.
Calculate the Equity Risk Premium (ERP): Subtract the risk-free rate from the expected market return.
Where,
Rm = Average return from market (in my case NIFTY50.)
Rf = Risk free rate
Beta (β) Coefficient: Beta measures how volatile a stock is compared to the market as a whole. A beta of 1 means the stock moves with the market, while less than 1 indicates lower volatility and more than 1 means higher volatility.
Calculating Beta Using Regression
Step-by-Step Process:
Gather Data:
Collect historical price data for the stock and the market index (e.g., S&P 500).
Calculate the returns for both the stock and the market for each time period (e.g., daily, monthly).
Plot the Data:
Create a scatter plot with the market returns on the x-axis and the stock returns on the y-axis.
Perform Regression Analysis:
Use statistical software or a calculator to run a linear regression. This will fit a line to the scatter plot.
The formula for the regression line is y=α+βx
where:yyy is the stock return,
xxx is the market return,
α\alphaα is the intercept (not important for beta),
β\betaβ is the slope of the line and represents the stock's beta.
Formula for Cost of Equity-
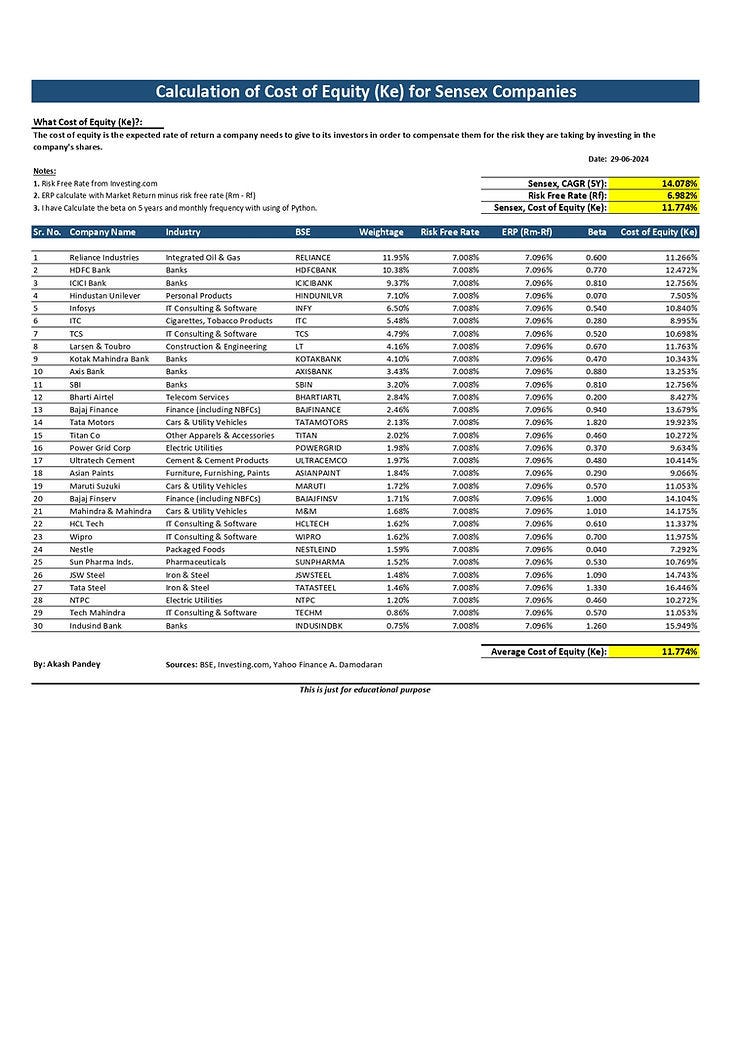
here is the NIFTY Cost of equity (Ke) calculation on Excel sheet;
Conclusion:
Understanding the cost of equity is crucial for making informed investment decisions. It helps investors gauge the potential returns required to justify the risks they take. By grasping this concept, you can better evaluate investment opportunities and build a stronger, more resilient portfolio. Keep learning, stay curious, and you'll continue to grow your financial knowledge and success.
Thank you for reading this article and I hope it helps you.
Please share your feedback in the comment box that could help me to grow.
Once again Thank You.


